
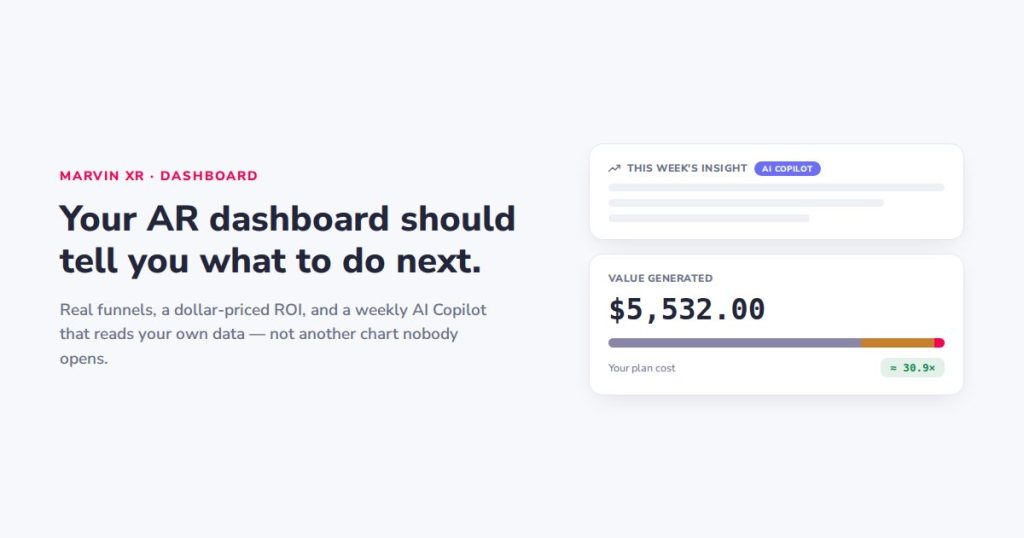
Most AR analytics stop at “here’s what happened.” That’s a report, not a plan. The redesigned Marvin XR dashboard is built to close that gap — turning campaign data into a weekly, prioritized list of what to do next, and pricing the whole thing in money your finance team already understands.
A funnel is a chart. A KPI tells you where to spend Monday morning.
Every AR platform can show you page views. Fewer show you the funnel that actually matters: how many of those views turned into a real 3D interaction, how many of those visitors stayed engaged long enough to matter, and how many became a captured, consented lead. Marvin XR’s Engagement Funnel tracks exactly that path, alongside average dwell time, new-versus-returning visitor split, and attribution by channel — so a campaign’s traffic quality is visible, not just its traffic volume.
The number that tends to get a merchandising team’s attention fastest is uplift: the conversion rate of visitors who engaged with the 3D model, compared against those who didn’t. Seeing that gap in your own numbers — not an industry benchmark, your numbers — is what turns “should we invest more in AR” from a debate into an easy call.
Value Generated: the card finance actually reads
Analytics dashboards tend to speak in engagement metrics; budgets are approved in currency. Value Generated bridges that by pricing every visitor at the standard market cost of the deepest funnel stage they reached — reach-only visitors at a cost-per-click rate, engaged visitors at a cost-per-interaction rate, and captured leads at a cost-per-lead rate — with nobody counted twice. The result is a single dollar figure: what this traffic would have cost to acquire through standard paid marketing, stated next to your actual plan cost as a plain ROI multiple.
It’s the difference between telling a CFO “we got good engagement this month” and telling them “this campaign returned 30 times its plan cost in equivalent paid-media value” — the second sentence is the one that gets next quarter’s budget approved.
AI Copilot: a weekly analyst, not another chart to check
Numbers only change behavior if someone actually looks at them every week, and most dashboards quietly assume that discipline exists. AI Copilot removes that assumption. Once a week, it reads your campaign’s real engagement data — funnel, dwell time, attribution, lead volume — and writes a short, plain-English summary of what changed and a concrete “what to do next” list: which channel is actually driving traffic, whether engaged viewers are converting meaningfully better than passive ones, how many hot leads haven’t been followed up yet. It never invents a number it wasn’t given — every line traces back to your own data.
That’s the shift from “insight predictor” to something closer to a junior analyst who never misses a Monday: it doesn’t just describe the graph, it tells the team which of the three things worth doing this week is worth doing first.
Leads scored, not just collected — and nurtured, not just exported
Behind the funnel sits a GDPR-consented lead capture flow: a contact card inside the AR experience itself, encrypted at rest, erasable on request. Every captured lead gets an intent score from 0 to 100, built from real signals — how long they engaged with the 3D model, where they came from, whether they’ve been back before. Hot, warm and cold prospects sort themselves, so the team’s attention goes to the five people worth calling today, not a spreadsheet of five hundred.
For the hottest of those, AI Copilot drafts a personalized outreach email — referencing the actual product they viewed and how engaged they were — ready to review and send. Nothing goes out automatically; a human always approves the message. What it removes is the blank-page problem that makes fast follow-up rare in practice, even though everyone agrees speed-to-lead matters.
Why this reads as a CRM, not just an analytics tab
Put those pieces together — a real funnel, a dollar-denominated ROI figure, a weekly AI-written action list, and scored leads with drafted follow-up — and what you get isn’t a reporting dashboard. It’s a lightweight sales-and-marketing system that a growth team would otherwise have to wire together out of a separate analytics tool, a separate CRM, and a separate copywriter, all pointed at data that a standard AR viewer never captures in the first place.
See your own numbers: the moment a campaign goes live, its funnel, Value Generated card and weekly AI Copilot insight start filling in from real traffic — not a demo, your data, from day one.